PROSPER Compass
SIPI's Prosperity Navigation Tool
An integrated qual-quant framework for systemic thinking and long-term value creation.
Why now
Why Switzerland needs a prosperity measure now.
The foundation
Switzerland's global competitiveness rests on a foundation of institutional stability, high innovation capacity, and export specialisation in high-value sectors — from textiles, watchmaking, and precision industries to chemicals, pharmaceuticals, and sophisticated services. An attractive business and regulatory environment draws top-tier talent and capital from around the world. This historical foundation remains remarkably strong and continues to position Switzerland among the world's leading economies.
The shift
However, the global and domestic conditions that shape long-term operational success are shifting faster than traditional decision-making frameworks can track. Demographic aging, the climate crisis, biodiversity loss, technological disruption, geopolitical uncertainty, and evolving expectations from employees, customers, investors and communities (on transparency, fair treatment and environmental responsibility) are creating new forms of exposure (and new demands on response capacity) that extend beyond conventional measures of economic performance; opportunity remains real, but it accrues to those who build response capacity early, in adaptation solutions, cleantech markets, and first-mover positioning.
For a small, highly open economy, Switzerland's prosperity also rests on a predictable, rules-based trading system. Yet the blockage of WTO Appellate Body dispute settlement since 2019, rising protectionism, and geopolitical fragmentation are putting that system — and the cross-border supply chains that depend on it — under growing pressure.
The signal
While Switzerland remains highly competitive, recent developments highlight that continued success cannot be taken for granted: in the 2026 IMD World Competitiveness Ranking, Switzerland fell from first to third place — a decline driven almost entirely by the Economic Performance factor (13th to 37th, with a sharp fall in international investment, 41st, down 35 places), while Government Efficiency and Infrastructure remained first worldwide.
Future prosperity therefore depends not only on limiting exposure to these shifts, but on the capacity to anticipate, learn, adapt, and transform as conditions change — a capacity addressed directly under the Resilient Economies pillar.
Framework
The PROSPER Narrative
The compass is a multidimensional framework advancing the thinking to help Switzerland become more resilient, equitable, healthy or sustainable.
Click any segment of the compass to explore its narrative, outcomes, and systemic links
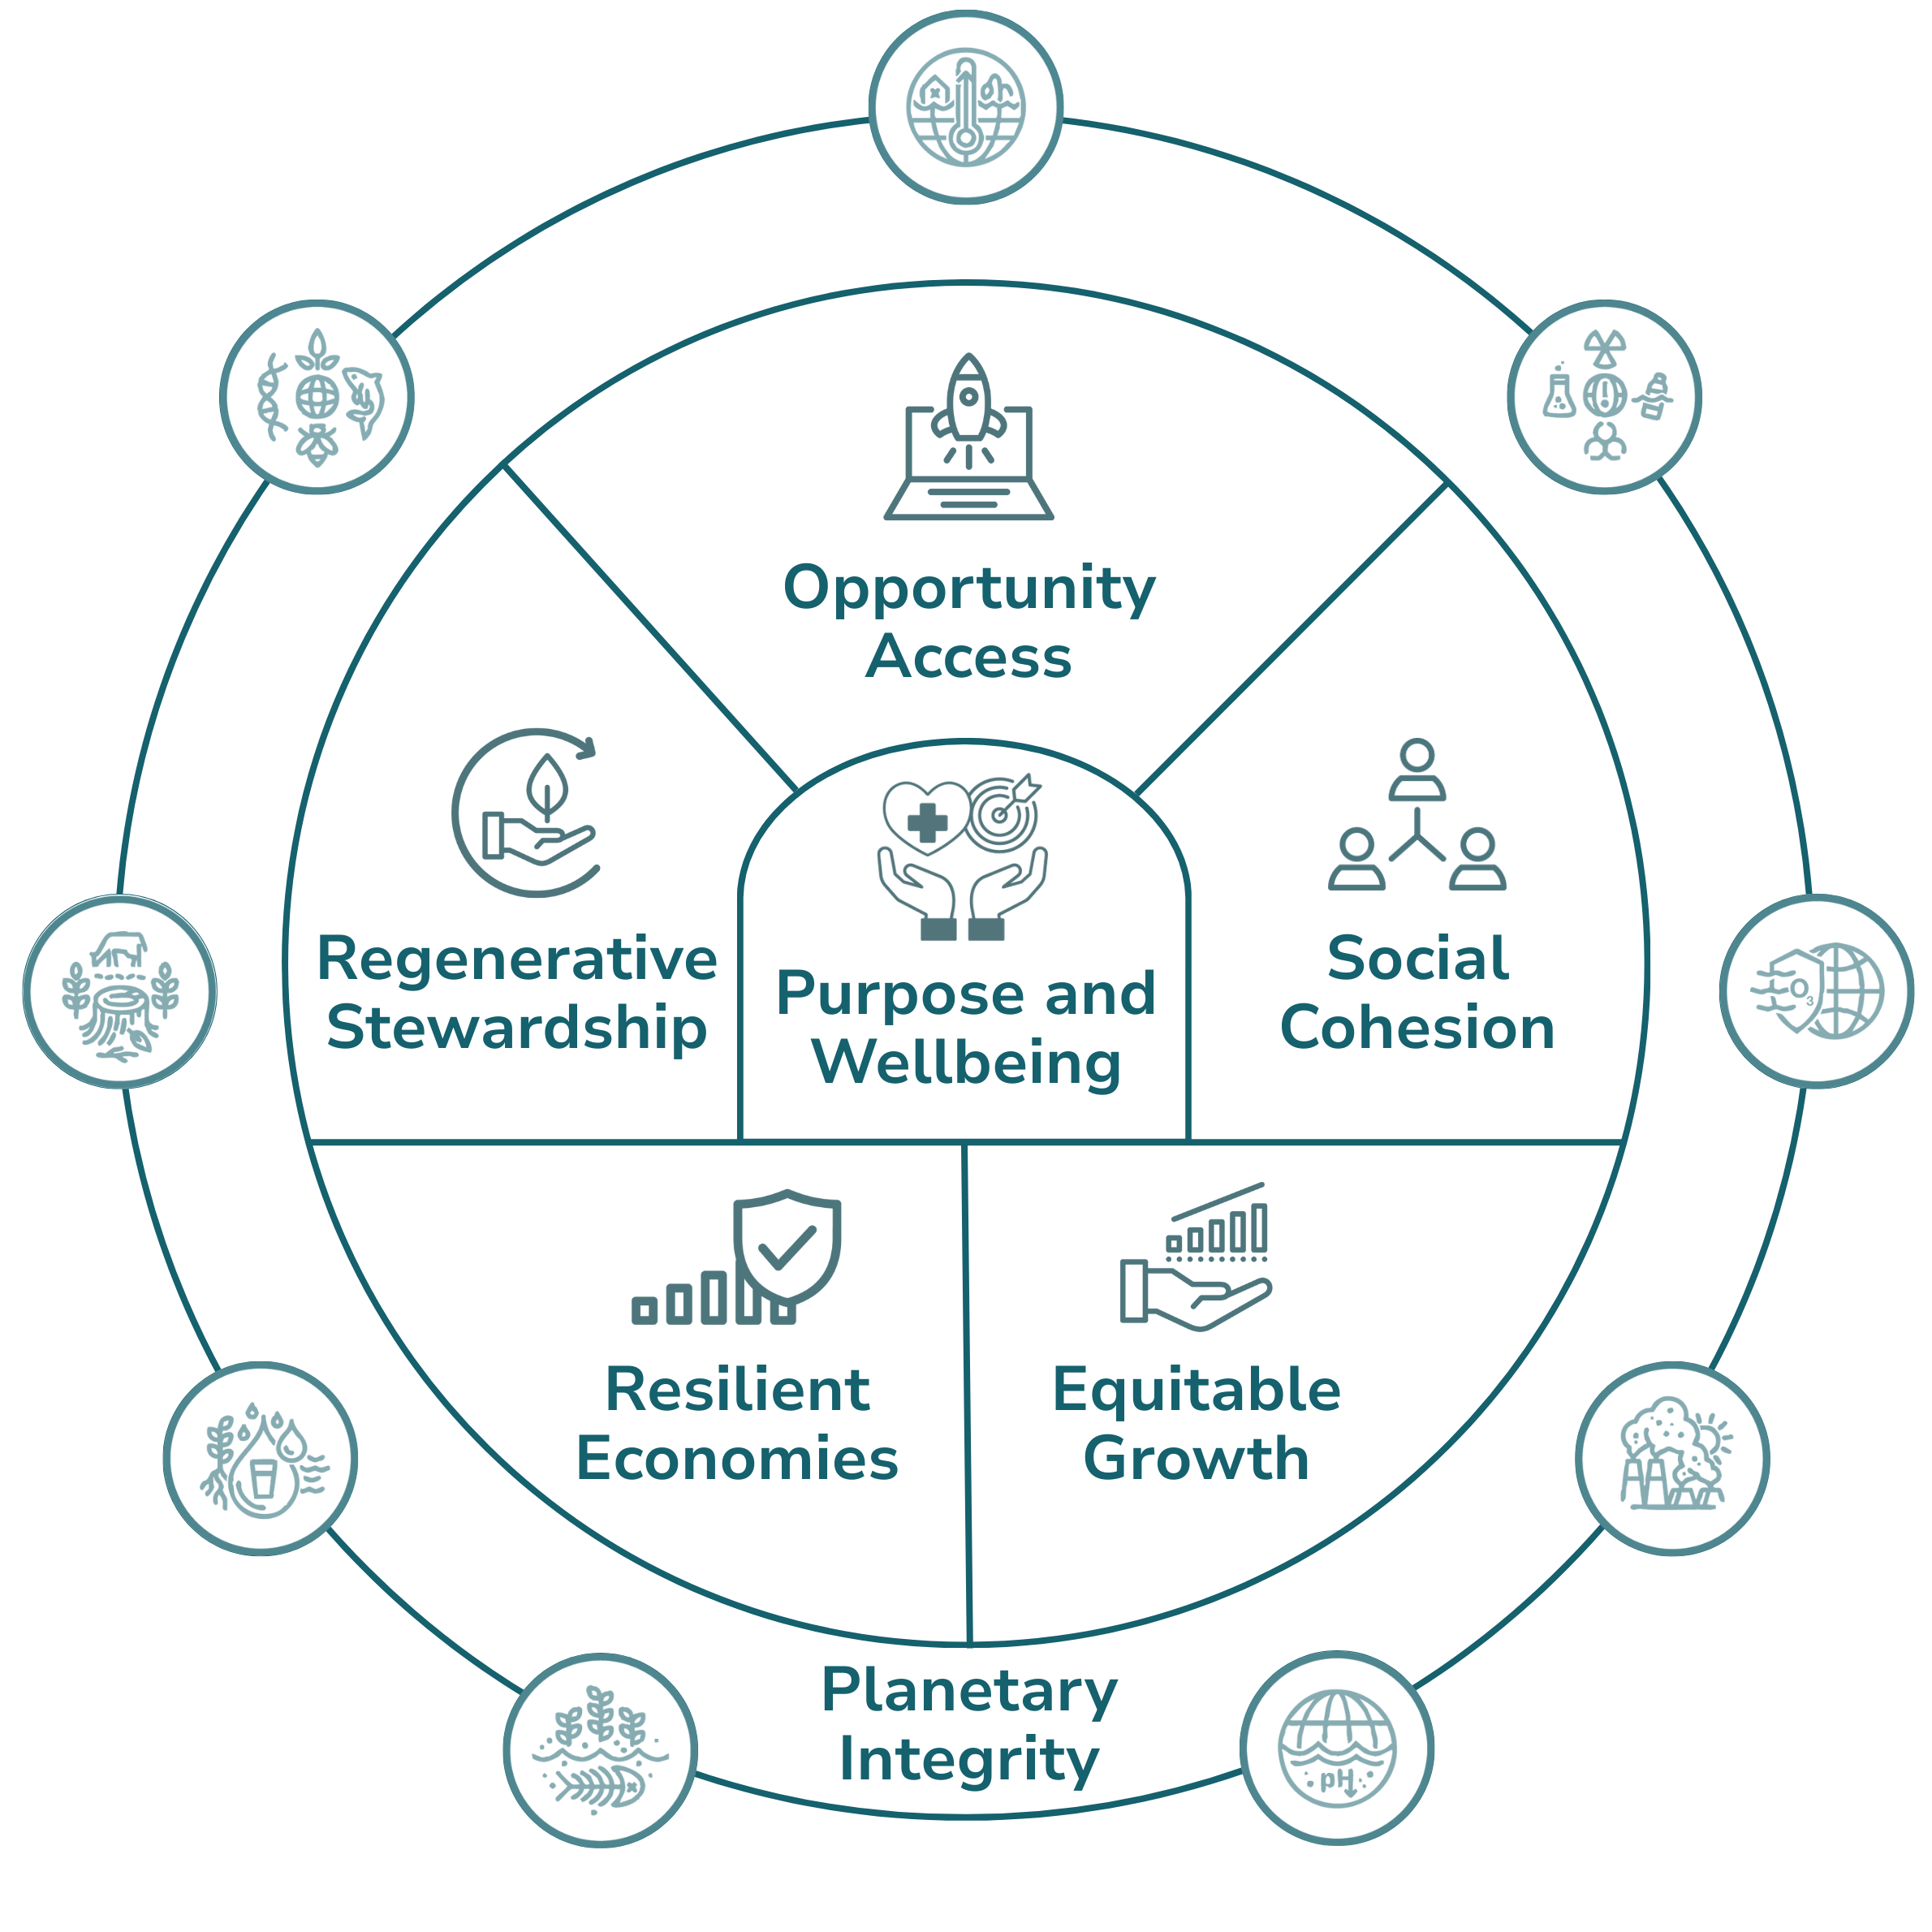
Tap any segment to explore
Each pillar of the PROSPER Compass represents an interconnected force shaping our collective future. Together they form a systemic lens — no single pillar works alone.
Opportunity Access
As human and social capital compound, opportunity expands. Access to knowledge, networks, and meaningful work becomes available to all — not just the few — creating conditions where talent flourishes regardless of origin or circumstance.
Social Cohesion
Strong communities form the connective tissue of a prosperous society. Cohesion is built through trust, shared purpose, and inclusive participation — where diversity becomes a source of collective resilience rather than division.
Equitable Growth & Innovation
Competition shifts from extraction to long-term value creation. Equitable growth means value is created and broadly shared — with innovation and investment directed toward equitable societal outcomes, and their gains reaching smaller actors and communities.
Planetary Integrity
Operating within planetary boundaries is the precondition for everything else. Planetary integrity means respecting the Earth's carrying capacity — where economic activity regenerates natural systems rather than degrading them.
Resilient Economies
Economic resilience means the capacity to absorb shocks, adapt to change, and recover stronger. Resilient economies diversify, invest in people, and build redundancy into critical systems — including value chains able to withstand geopolitical, public-health, and trade shocks — rather than optimising for efficiency alone.
Regenerative Stewardship
Stewardship moves beyond compliance to active regeneration. Leaders and organisations take responsibility not just for their own impacts, but for the health of the broader living systems they depend on — accountable to future generations.
Purpose & Wellbeing
At the heart of the PROSPER Compass lies a simple conviction: the purpose of any system is to support human flourishing. AI–human teaming, longer and healthier lives, and affordable nutritious food are not aspirations — they are design requirements.
Indicators & Definitions
Integrated Prosperity Measurement
The PROSPER Compass is a multidimensional framework designed to measure prosperity consistently across organisational, sectoral, and territorial levels. It translates systemic wellbeing into a structured indicator architecture that enables organisations, investors, and public institutions to assess and steer their contribution to prosperity beyond financial performance alone.
Rather than replacing existing standards, it acts as an integration layer across frameworks such as GRI, ESRS, VSME, Cercle Indicateurs, and MONET as well as other national indicators. Its role is to create coherence across levels and establish the relational logic currently missing between corporate, regional, and national measurement systems.
At the regional and national levels, the Compass draws exclusively on published FSO/ARE open data (MONET 2030, Cercle Indicateurs), so every reading can be traced to its official source; the framework is neither produced, endorsed nor reviewed by the federal statistical offices. The Compass complements — it does not replace — a competitive, growing economy: it measures whether growth converts into enduring prosperity.
Framework V1.6 — ratified 11 September 2026 · Indicator Registry v0.7: 116 indicators (37 enterprise, 38 regional, 41 national).
P
Purpose & Wellbeing
Supporting physical and mental health for purposeful human flourishing.
Definition
Purpose & Wellbeing puts human flourishing at the centre of personal, organisational, and public life. Basic health, food and safety are its floor. Above that floor it tracks what makes a life go well: meaningful work, strong communities, and a sense of purpose — fostering meaning through culture and belief while building care systems that sustain people across every stage of life. Human flourishing also depends on a healthy relationship with the living world: this pillar holds people's access to and connection with nature as lived experience, while ecosystem condition and environmental pressure are measured under Planetary Integrity.
Why it matters
Switzerland performs well on income and safety by conventional measures, yet mental-health burden, workplace stress, and rising disengagement from work and civic life signal a real gap between material prosperity and lived experience.
Indicators (selection)
Corporate
- Work-related accidents & LTIR
- Employee satisfaction / eNPS
- Sick leave per FTE
- Mental health support access (EAP coverage)
Regional
- Potential years of life lost
- Traffic noise exposure
- Public culture and leisure expenditure per capita
- Road accident rate
- Mental health hospitalisation rate
National
- Life satisfaction score
- Healthy life expectancy
- Moderate or high psychological distress (Swiss Health Survey)
- Suicide rate
R
Regenerative Stewardship
Going beyond compliance to actively restore natural and social capital.
Definition
Regenerative Stewardship calls on all actors — organisations, governments, and communities — to move beyond harm reduction toward active restoration. It covers natural capital stocks, circular material flows, ecosystem services, and the governance of long-term commitments that transcend political and business cycles. Those operating under this pillar are accountable not only for their direct impact, but also for the health of the broader living systems on which they depend.
Why it matters
Some types of damage cannot be easily undone. Crises like biodiversity loss, soil damage, and water depletion outlast any typical political term or business plan.
Indicators (selection)
Corporate
- Waste reduction & recycling rate
- Circular material use rate
- Biodiversity restoration initiatives
- SBTi alignment status
Regional
- Biodiversity preservation and promotion areas
- Plant species diversity index
- Separately collected municipal waste
- Wastewater treatment rate (via WWTP, ARA/STEP)
- Municipal waste generation per capita
- Agricultural land quality / soil sealing rate
National
- Swiss Bird Index (SBI® Regular Breeding Birds)
- Material footprint per person
- Recycling rate
- Net GHG balance of the LULUCF sector (Swiss GHG Inventory)
- Nitrogen balance in agriculture
- Phosphorus balance in agriculture
- Fulfilment of climate policy targets
O
Opportunity Access
Ensuring that talent, knowledge, and economic opportunity are equitably distributed.
Definition
Opportunity Access measures whether the conditions for a good working and civic life are fairly distributed. It covers fair access to the job market, equal pay, quality education, social mobility and services. Inclusion is understood as social, digital and financial — financial inclusion is one measurable access channel among these, not the heading. Legal and systemic protections count only where they give real, practical access rather than on-paper promises. Crucially, this pillar focuses on tackling structural exclusion: the ways in which a person's gender, origin, or socioeconomic background can limit their participation in economic, social, and civic life before they even have the opportunity to contribute based on their own efforts. Housing and spatial access belong to this pillar: affordability and physical access to opportunity are access questions, not cohesion questions.
Why it matters
When access to opportunities is restricted by systemic barriers, economic potential is wasted and trust in society breaks down.
Indicators (selection)
Corporate
- Gender composition & employee turnover
- Living wage compliance
- Adjusted gender pay gap
- Training hours per employee
- Female representation in management
- Human rights & grievance mechanism
- Board gender diversity
Regional
- Unemployment rate
- Women in cantonal parliament
- Upper secondary certification rate
- Public transport proximity
- Rental price levels
National
- Educational attainment levels
- Female labour participation rate
- Women in management
- Gender pay gap (unexplained component, FSO wage-structure analysis)
- NEET rate
- Internet use and digital skills (FSO ICT survey)
- Housing cost burden
- Gender underemployment gap (SAKE)
S
Social Cohesion
Building trust, legitimacy, and the capacity for collective action.
Definition
Social Cohesion addresses the relational, civic, and institutional bonds that make collective life possible. It encompasses interpersonal and institutional trust, civic engagement, cultural belonging, and the legal foundations for collective action. It covers how organisations behave as members of the communities they operate in, how public institutions earn and sustain legitimacy, and how residents themselves build trust and solidarity through their own participation — and the way societies manage differences: whether diversity becomes a source of collective resilience or a fault line of division, whether solidarity networks hold under pressure, and whether institutions retain legitimacy when acting on behalf of those they serve. In an inclusive society, differences are recognised and can become a source of collective capability and resilience.
Why it matters
No system, however technically well-designed, functions efficiently without the trust and legitimacy to sustain it.
Indicators (selection)
Corporate
- Anti-corruption violations
- Confirmed discrimination & labour rights incidents
- Stakeholder engagement process maturity
- Lobbying transparency
- Supplier payment compliance
Regional
- Voter participation
- Serious violent offences
- Civic association membership and volunteering
- Social assistance rate
- Standardised naturalisation rate
National
- Corruption Perceptions Index
- Poverty rate
- Trust in the Federal Council (ETH CSS Sicherheit study, MONET 16.3)
- Victims of severe domestic violence (PKS, MONET monet-5.2)
- ILO unemployment-rate gap by migration status (SAKE, FSO integration indicators)
P
Planetary Integrity
Operating within the Earth's ecological boundaries through science-based stewardship.
Definition
Planetary Integrity measures the aggregate pressure that production, consumption, and public policy together place on the Earth's systems. It is anchored to the planetary-boundaries framework, covering climate stability, biosphere integrity, freshwater availability, land-system change, and biogeochemical flows. It asks not only whether actors are reducing harm, but whether the pace and scale of their activities remain within the limits that sustain the conditions for human flourishing. The dependence runs both ways: a healthy natural environment underpins human flourishing, so people's access to and connection with nature are measured under Purpose & Wellbeing, while this pillar holds ecosystem condition, pollution, biodiversity, land use, and ecological pressure.
Why it matters
Planetary boundaries are not a metaphor: they mark the limits beyond which the risk of large-scale, potentially irreversible changes to Earth systems rises sharply.
Indicators (selection)
Corporate
- Scope 1–3 GHG emissions
- Energy consumption
- Renewable energy share
- Pollutant emissions
- Water withdrawal incl. water-stressed areas
- Sites near biodiversity-sensitive areas
- Revenue from exclusion-list sectors (EU PAB, CDR (EU) 2020/1818 Art. 12)
Regional
- Energy-related CO2 emissions per capita
- Energy consumption
- Renewable electricity share
- Air pollution index
- Groundwater nitrates
- Built-up area as % of total territory
National
- GHG emissions
- Air quality (population-weighted PM2.5 exposure, FOEN PolluMap)
- Swiss ecological footprint
- Protected areas
- Share of renewables
E
Equitable Growth & Innovation
Ensuring that economic gains are broadly shared, not concentrated at the top.
Definition
Equitable Growth & Innovation addresses how economic value is created and shared across businesses, policy frameworks, and communities. It does not treat growth as an end in itself, but asks a fundamental question: does economic value reach people broadly or accumulate narrowly? This pillar shifts the focus from aggregate output to distributive outcomes — examining income and wealth distribution, labour's share of income, corporate governance, and smaller actors' access to innovation. Ultimately, it ensures that productivity gains, technology, and AI serve the many rather than the few, distributing both their benefits and their risks fairly.
Why it matters
Economic growth without equitable distribution can produce prosperity on the balance sheet that does not reflect in daily life: rising output can coexist with stagnant wages, widening regional divides, and shrinking opportunity for the majority.
Indicators (selection)
Corporate
- R&D investment as % of revenue
- Profit-sharing (non-management)
- CEO-to-median worker pay ratio
- Labour income share
Regional
- Cantonal GDP per capita
- Cantonal labour productivity (GVA per FTE)
- Tax burden (cantonal composite)
- Innovation sector employment share
- Patent applications per capita
- Cantonal income inequality (Gini of equivalised net income, tax register)
National
- Top 1% income share
- Top 1% wealth share (net taxable wealth)
- Income inequality (Gini, equivalised disposable income, FSO/SILC)
- Labour productivity
- Global Innovation Index rank
R
Resilient Economies
Building the capacity to absorb major shocks and recover without lasting economic or social damage.
Definition
Resilient Economies measures how effectively organisations, systems, and communities can withstand sudden disruptions and adapt without permanently harming public wellbeing. It covers economic diversification, financial stability, supply-chain resilience, physical and transition risks from climate change, fiscal sustainability, and secure access to essential goods like food and energy. Crucially, resilience is different from simple efficiency: it requires back-up systems and flexibility, rather than just cutting costs to optimise for the short term.
Why it matters
Efficiency without a backup plan leads to fragility. Recent disruptions in global energy supplies, financial markets, and supply chains have proven that resilience is not a luxury — it is a requirement for long-term prosperity.
Indicators (selection)
Corporate
- Sustainability strategy integration
- Climate risk assessment
- Business continuity planning
- Supply chain mapping depth
- Revenue concentration (largest single customer or market, % of revenue)
- Liquidity runway
Regional
- Public debt ratio
- Healthcare system capacity (physician density, Obsan)
- Agricultural land per capita
- Infrastructure maintenance investment
- Hospital bed capacity
National
- CET1 capital ratio of the Swiss banking sector (SNB Financial Stability Report)
- Energy import dependency (share of gross energy consumption covered by net imports, MONET monet-7.1)
- Economic Complexity Index
- ND-GAIN Country Index
- Coverage of compulsory stocks (Pflichtlager) vs statutory targets (FONES)
- Export concentration (HHI, goods exports)
- Net food self-sufficiency rate (Agristat food balance, FOAG Agrarbericht)
Applications
PROSPER in practice.
-
PROSPER Compass for SMEs
Amidst evolving regulation, SIPI has developed a PROSPER Compass grounded in the voluntary EFRAG VSME standard — lighter than any EU reporting regime — and calibrated to Swiss benchmarks. A first pilot with SMEs will focus on usability and decision-usefulness.
-
Impact Valuation & System Integration
Leverage systems thinking and impact valuation to support integration across organisational and territorial systems, creating a coherent basis for comparing, interpreting, and aligning prosperity pathways and outcomes across levels.
-
PROSPER Innovation Playbook
Develop a practical playbook to help innovators and investors across SIPI Grand Challenges define, assess, and improve their contribution to prosperity by translating systemic effects into actionable insights for net-positive innovation and capital allocation.
Co-develop the PROSPER Compass
We invite researchers, practitioners to contribute to the selection of indicators, the methodology development, and piloting compass.